A Jupyter Notebook with the analysis and prediction of Final Grades (Pass/Fail) for students of mechatronics engineering in several mechanic courses.
The dataset contains the grade records for several students of the Mechatronics Engineering Program from 2020 to 2023. Each semesters is splitted into three periods (G1, G3, G3). The Final Grade (FG) is calculated based on the grades from each period using the following equation:
The grade scale ranges from 0.00 to 5.00.
A student approves a class if
All classes belong to the mechanic area of the program. This Mechatronics Engineering Program has a duration 10 semesters (5 years)
- ID: Student's ID, which increases according to its starting year
- Sex: Student's sex (M: Male, F: Female)
- Class: Class name
- Material Science
- Mechanic of Materials
- Applied Dynamics
- Fluid Mechanics
- Thermofluids
- Material Selection
- Forensic Engineering
- Semester: Semester in which the class is taught
- 3
- 5
- 6
- 8
- 9
- Year: Year of the record
- Type: Type of semester
- Spring
- Fall
- G1: Grades for the first period of the semester
- G2: Grades for the second period of the semester
- G3: Grades for the third period of the semester
- FG: Final Grades
Several data analysis were performed such as:
- Proportion Male and Female students
- Students dristibtion per classes, year, type of semester
- Grades Distribution per period and final grade
- Create a column for the College Level for each class based on the credit hours
- freshmen: 0–30 hours
- sophomore: 31–60 hours
- junior: 61–90 hours
- senior: 90+ hours
- Pandemic performance comparison
- Pass/Fail rate
In addition, some question were proposed:
- How has the female proportion changed for each semester?
- Has the number of women increased in the recent generations?
- Who has had a better performance?
- Performance Before and After Pandemic
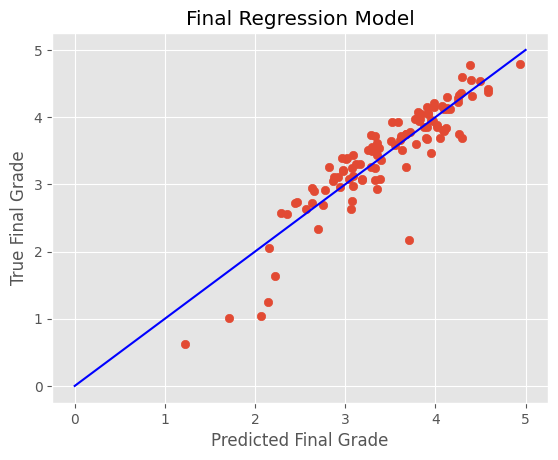
6 regression models were compared based on the Final Grade, using cross-validation, recursive feature elimination (RFE), and R2-Score as a metric:
- Linear Regression
- Ridge Regression
- Lasso Regression
- Support Vector Regression (SVR)
- Random Forest Regression
- Polynomial Regression
The best regression model was Linear Regression with a predictive score above 80%
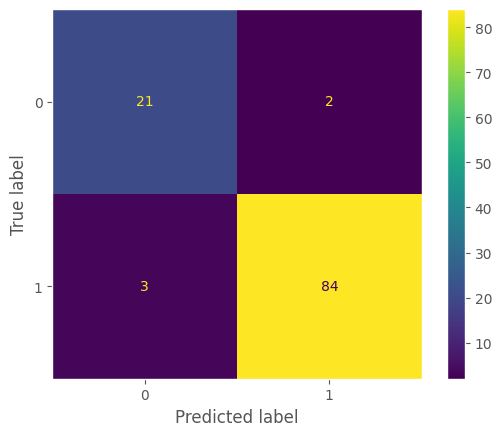
3 binary classification models were compared based on the classes Pass or Fail, using cross-validation, recursive feature elimination (RFE), and F1 weighted-Score as a metric and confussion matrix:
- Logistic Regression
- Support Vector Classifier (SVC)
- Random Forest Classifier
The best regression model was Logistic Regression with a predictive score above 90%

