A relay for carbon streams, in go. Like carbon-relay from the graphite project, except it:
- performs better: should be able to do about 100k ~ 1M million metrics per second depending on configuration
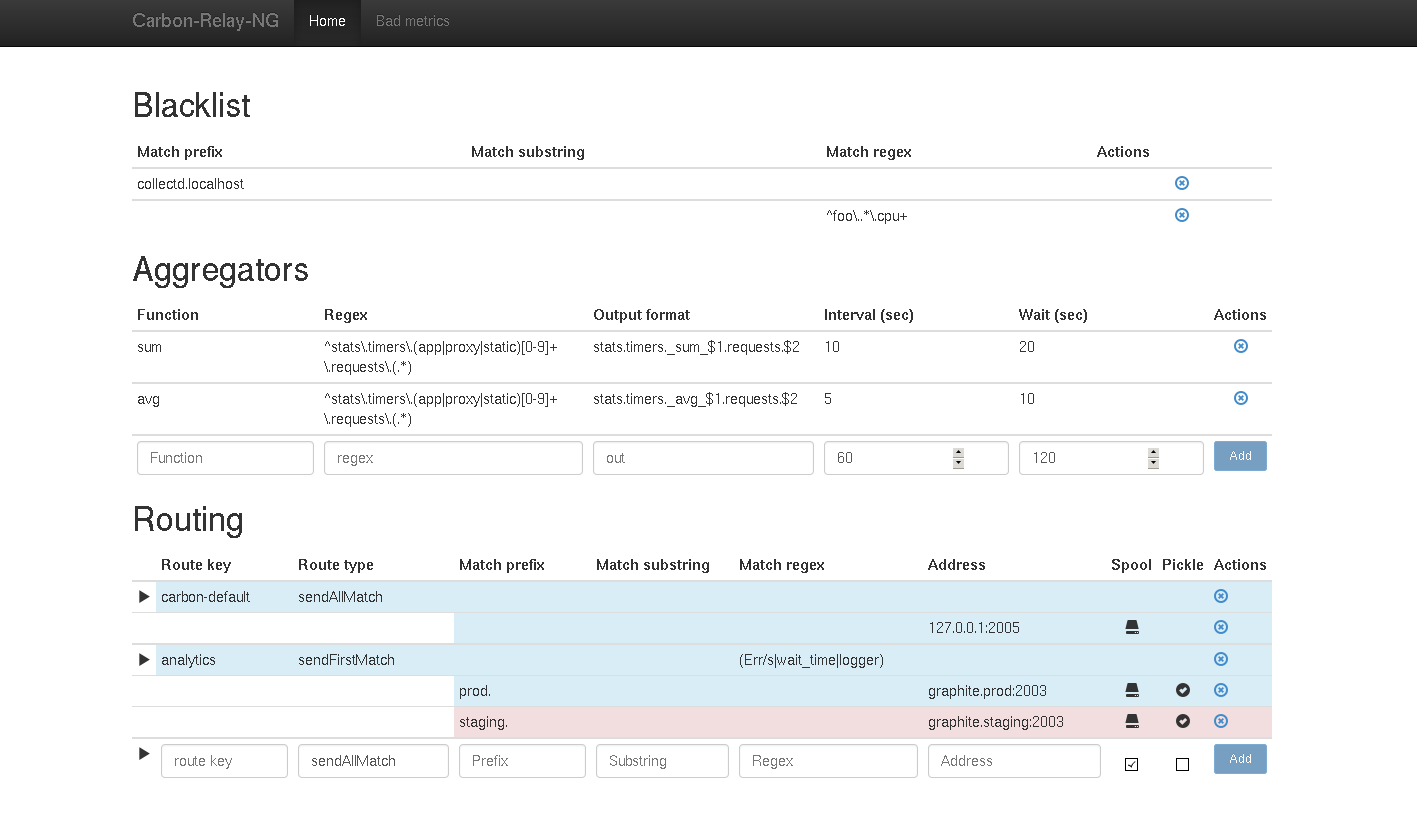
- you can adjust the routing table at runtime, in real time using the web or telnet interface (interfaces need more work)
- has aggregator functionality built-in
- supports a per-route spooling policy. (i.e. in case of an endpoint outage, we can temporarily queue the data up to disk and resume later)
- you can choose between plaintext or pickle output, per route.
- can be restarted without dropping packets (needs testing)
- performs validation on all incoming metrics (see below)
This makes it easy to fanout to other tools that feed in on the metrics. Or balance/split load, or provide redundancy, or partition the data, etc. This pattern allows alerting and event processing systems to act on the data as it is received (which is much better than repeated reading from your storage)
- multi-node clustered high availability (open for discussion whether it's worth it)
- pub-sub interface, maybe
see https://github.com/graphite-ng/carbon-relay-ng/releases
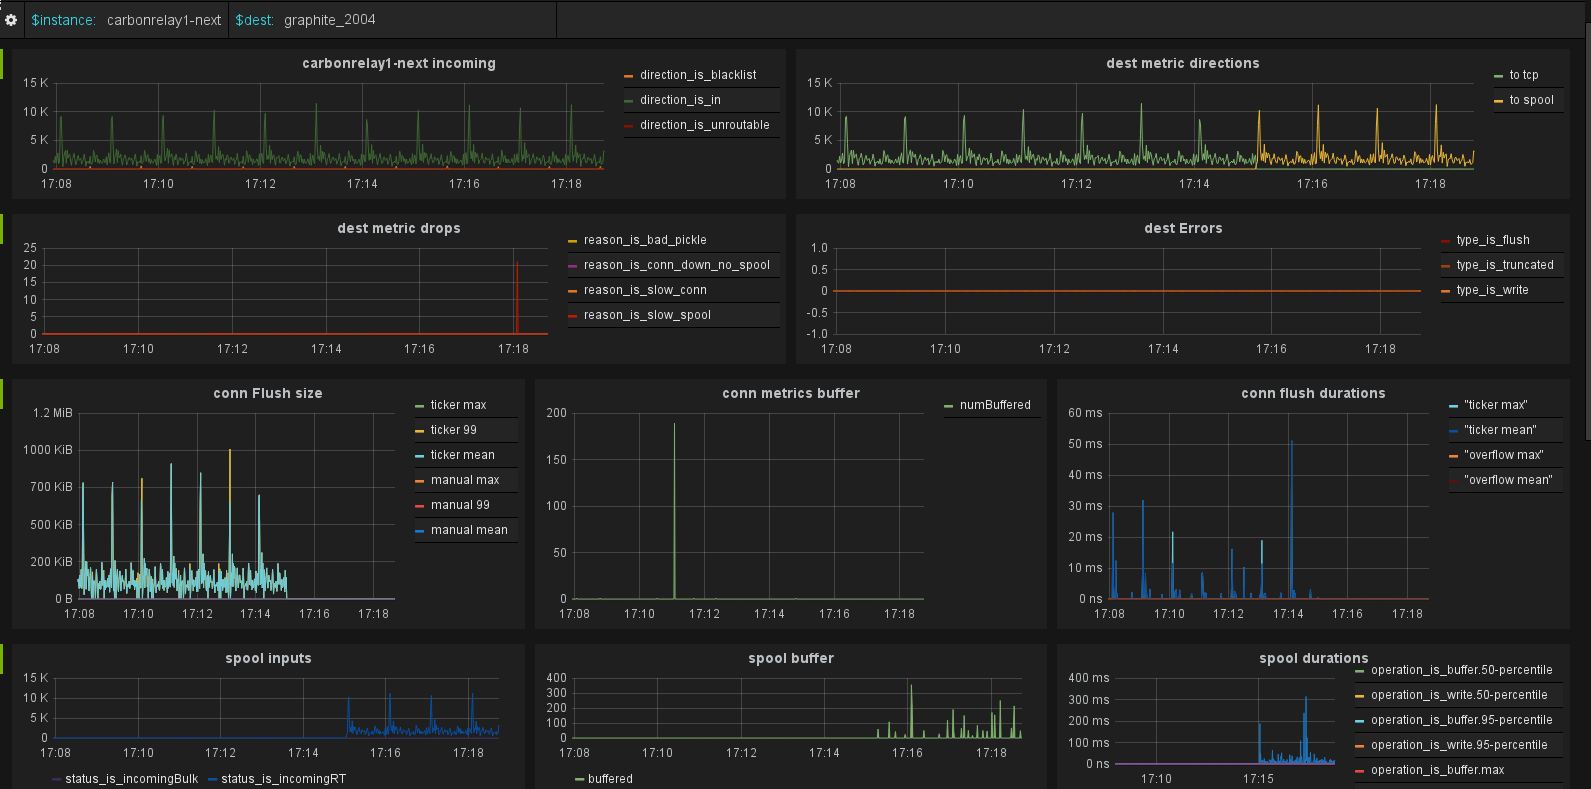
- Extensive performance variables are available in json at http://localhost:8081/debug/vars2 (update port if you change it in config)
- You can also send metrics to graphite (or feed back into the relay), see config.
- Comes with a grafana dashboard template so you get up and running in no time.
- UPDATE: you can now get the dashboard on grafana.net !
Requires Go 1.4 or higher. We use https://github.com/kardianos/govendor to manage vendoring 3rd party libraries
export GOPATH=/some/path/
export PATH="$PATH:$GOPATH/bin"
go get -d github.com/graphite-ng/carbon-relay-ng
go get github.com/jteeuwen/go-bindata/...
cd "$GOPATH/src/github.com/graphite-ng/carbon-relay-ng"
# optional: check out an older version: git checkout v0.5
make
You only need the compiled binary and a config. Put them whereever you want.
carbon-relay-ng [-cpuprofile cpuprofile-file] config-fileYou have 1 master routing table. This table contains 0-N routes. Each route can contain 0-M destinations (tcp endpoints)
First: "matching": you can match metrics on one or more of: prefix, substring, or regex. All 3 default to "" (empty string, i.e. allow all). Note that the matching is applied to the entire metric line (including key, value and timestamp). The conditions are AND-ed. Regexes are more resource intensive and hence should - and often can be - avoided.
-
All incoming matrics are validated and go into the table when valid.
-
The table will then check metrics against the blacklist and discard when appropriate.
-
Then metrics pass through the rewriters and are modified if applicable.
-
The table sends the metric to:
- the aggregators, who match the metrics against their rules, compute aggregations and feed results back into the table. see Aggregation section below for details.
- any routes that matches
-
The route can have different behaviors, based on its type:
- sendAllMatch: send all metrics to all the defined endpoints (possibly, and commonly only 1 endpoint).
- sendFirstMatch: send the metrics to the first endpoint that matches it.
- consistentHashing: the algorithm is the same as Carbon's consistent hashing.
- round robin: the route is a RR pool (not implemented)
carbon-relay-ng (for now) focuses on staying up and not consuming much resources.
if connection is up but slow, we drop the data if connection is down and spooling enabled. we try to spool but if it's slow we drop the data if connection is down and spooling disabled -> drop the data
All incoming metrics undergo some basic sanity checks before the metrics go into the routing table. We always check the following:
- the value parses to an int or float
- the timestamp is a unix timestamp
By default, we also apply the following checks to the metric name:
- has 3 fields
- the key has no characters beside
a-z A-Z _ - . =(fairly strict but graphite causes problems with various other characters) - has no empty node (like field1.field2..field4)
However, for legacy metrics, the legacy_metric_validation configuration parameter can be used to loosen the metric name checks. This can be useful when needing to forward metrics whose names you do not control.
The following are valid values for the legacy_metric_validation field:
strict-- All checks described above are in force. This is the default.medium-- We validate that the metric name has only ASCII characters and no embedded NULLs.none-- No metric name checks are performed.
If we detect the metric is in metrics2.0 format we also check proper formatting, and unit and target_type are set.
Invalid metrics are dropped and can be seen at /badMetrics/timespec.json where timespec is something like 30s, 10m, 24h, etc. (the counters are also exported. See instrumentation section)
You can also validate that for each series, each point is older than the previous. using the validate_order option. This is helpful for some backends like grafana.net
As discussed in concepts above, we can combine, at each point in time, the points of multiple series into a new series. Note:
- The interval parameter let's you quantize ("fix") timestamps, for example with an interval of 60 seconds, if you have incoming metrics for times that differ from each other, but all fall within the same minute, they will be counted together.
- The wait parameter allows up to the specified amount of seconds to wait for values, With a wait of 120, metrics can come 2 minutes late and still be included in the aggregation results.
- The fmt parameter dictates what the metric key of the aggregated metric will be. use $1, $2, etc to refer to groups in the regex
- Note that we direct incoming values to an aggregation bucket based on the interval the timestamp is in, and the output key it generates.
This means that you can have 3 aggregation cases, based on how you set your regex, interval and fmt string.
- aggregation of points with different metric keys, but with the same, or similar timestamps) into one outgoing value (~ carbon-aggregator). if you set the interval to the period between each incoming packet of a given key, and the fmt yields the same key for different input metric keys
- aggregation of individual metrics, i.e. packets for the same key, with different timestamps. For example if you receive values for the same key every second, you can aggregate into minutely buckets by setting interval to 60, and have the fmt yield a unique key for every input metric key. (~ graphite rollups)
- the combination: compute aggregates from values seen with different keys, and at multiple points in time.
- functions currently available: avg and sum
- aggregation output is routed via the routing table just like all other metrics. Note that aggregation output will never go back into aggregators (to prevent loops) and also bypasses the validation and blacklist.
- see the included ini for examples
Look at the included carbon-relay-ng.ini, it should be self describing. In the init option you can create routes, populate the blacklist, etc using the same command as the telnet interface, detailed below. This mechanism is choosen so we can reuse the code, instead of doing much configuration boilerplate code which would have to execute on a declarative specification. We can just use the same imperative commands since we just set up the initial state here.
commands:
help                                         show this menu
view                                         view full current routing table

addBlack <prefix|sub|regex> <substring>      blacklist (drops matching metrics as soon as they are received)

addAgg <func> <regex> <fmt> <interval> <wait>  add a new aggregation rule.
         <func>:                             aggregation function to use
           sum
           avg
         <regex>                             regex to match incoming metrics. supports groups (numbered, see fmt)
         <fmt>                               format of output metric. you can use $1, $2, etc to refer to numbered groups
         <interval>                          align odd timestamps of metrics into buckets by this interval in seconds.
         <wait>                              amount of seconds to wait for "late" metric messages before computing and flushing final result.


addRoute <type> <key> [opts]   <dest>  [<dest>[...]] add a new route. note 2 spaces to separate destinations
         <type>:
           sendAllMatch                      send metrics in the route to all destinations
           sendFirstMatch                    send metrics in the route to the first one that matches it
           consistentHashing                 distribute metrics between destinations using a hash algorithm
         <opts>:
           prefix=<str>                      only take in metrics that have this prefix
           sub=<str>                         only take in metrics that match this substring
           regex=<regex>                     only take in metrics that match this regex (expensive!)
         <dest>: <addr> <opts>
           <addr>                            a tcp endpoint. i.e. ip:port or hostname:port
                                             for consistentHashing routes, an instance identifier can also be present:
                                             hostname:port:instance
                                             The instance is used to disambiguate multiple endpoints on the same host, as the Carbon-compatible consistent hashing algorithm does not take the port into account.
           <opts>:
               prefix=<str>                  only take in metrics that have this prefix
               sub=<str>                     only take in metrics that match this substring
               regex=<regex>                 only take in metrics that match this regex (expensive!)
               flush=<int>                   flush interval in ms
               reconn=<int>                  reconnection interval in ms
               pickle={true,false}           pickle output format instead of the default text protocol
               spool={true,false}            enable spooling for this endpoint

addDest <routeKey> <dest>                    not implemented yet

modDest <routeKey> <dest> <opts>:            modify dest by updating one or more space separated option strings
               addr=<addr>                   new tcp address
               prefix=<str>                  new matcher prefix
               sub=<str>                     new matcher substring
               regex=<regex>                 new matcher regex

modRoute <routeKey> <opts>:                  modify route by updating one or more space separated option strings
               prefix=<str>                  new matcher prefix
               sub=<str>                     new matcher substring
               regex=<regex>                 new matcher regex

delRoute <routeKey>                          delete given route

