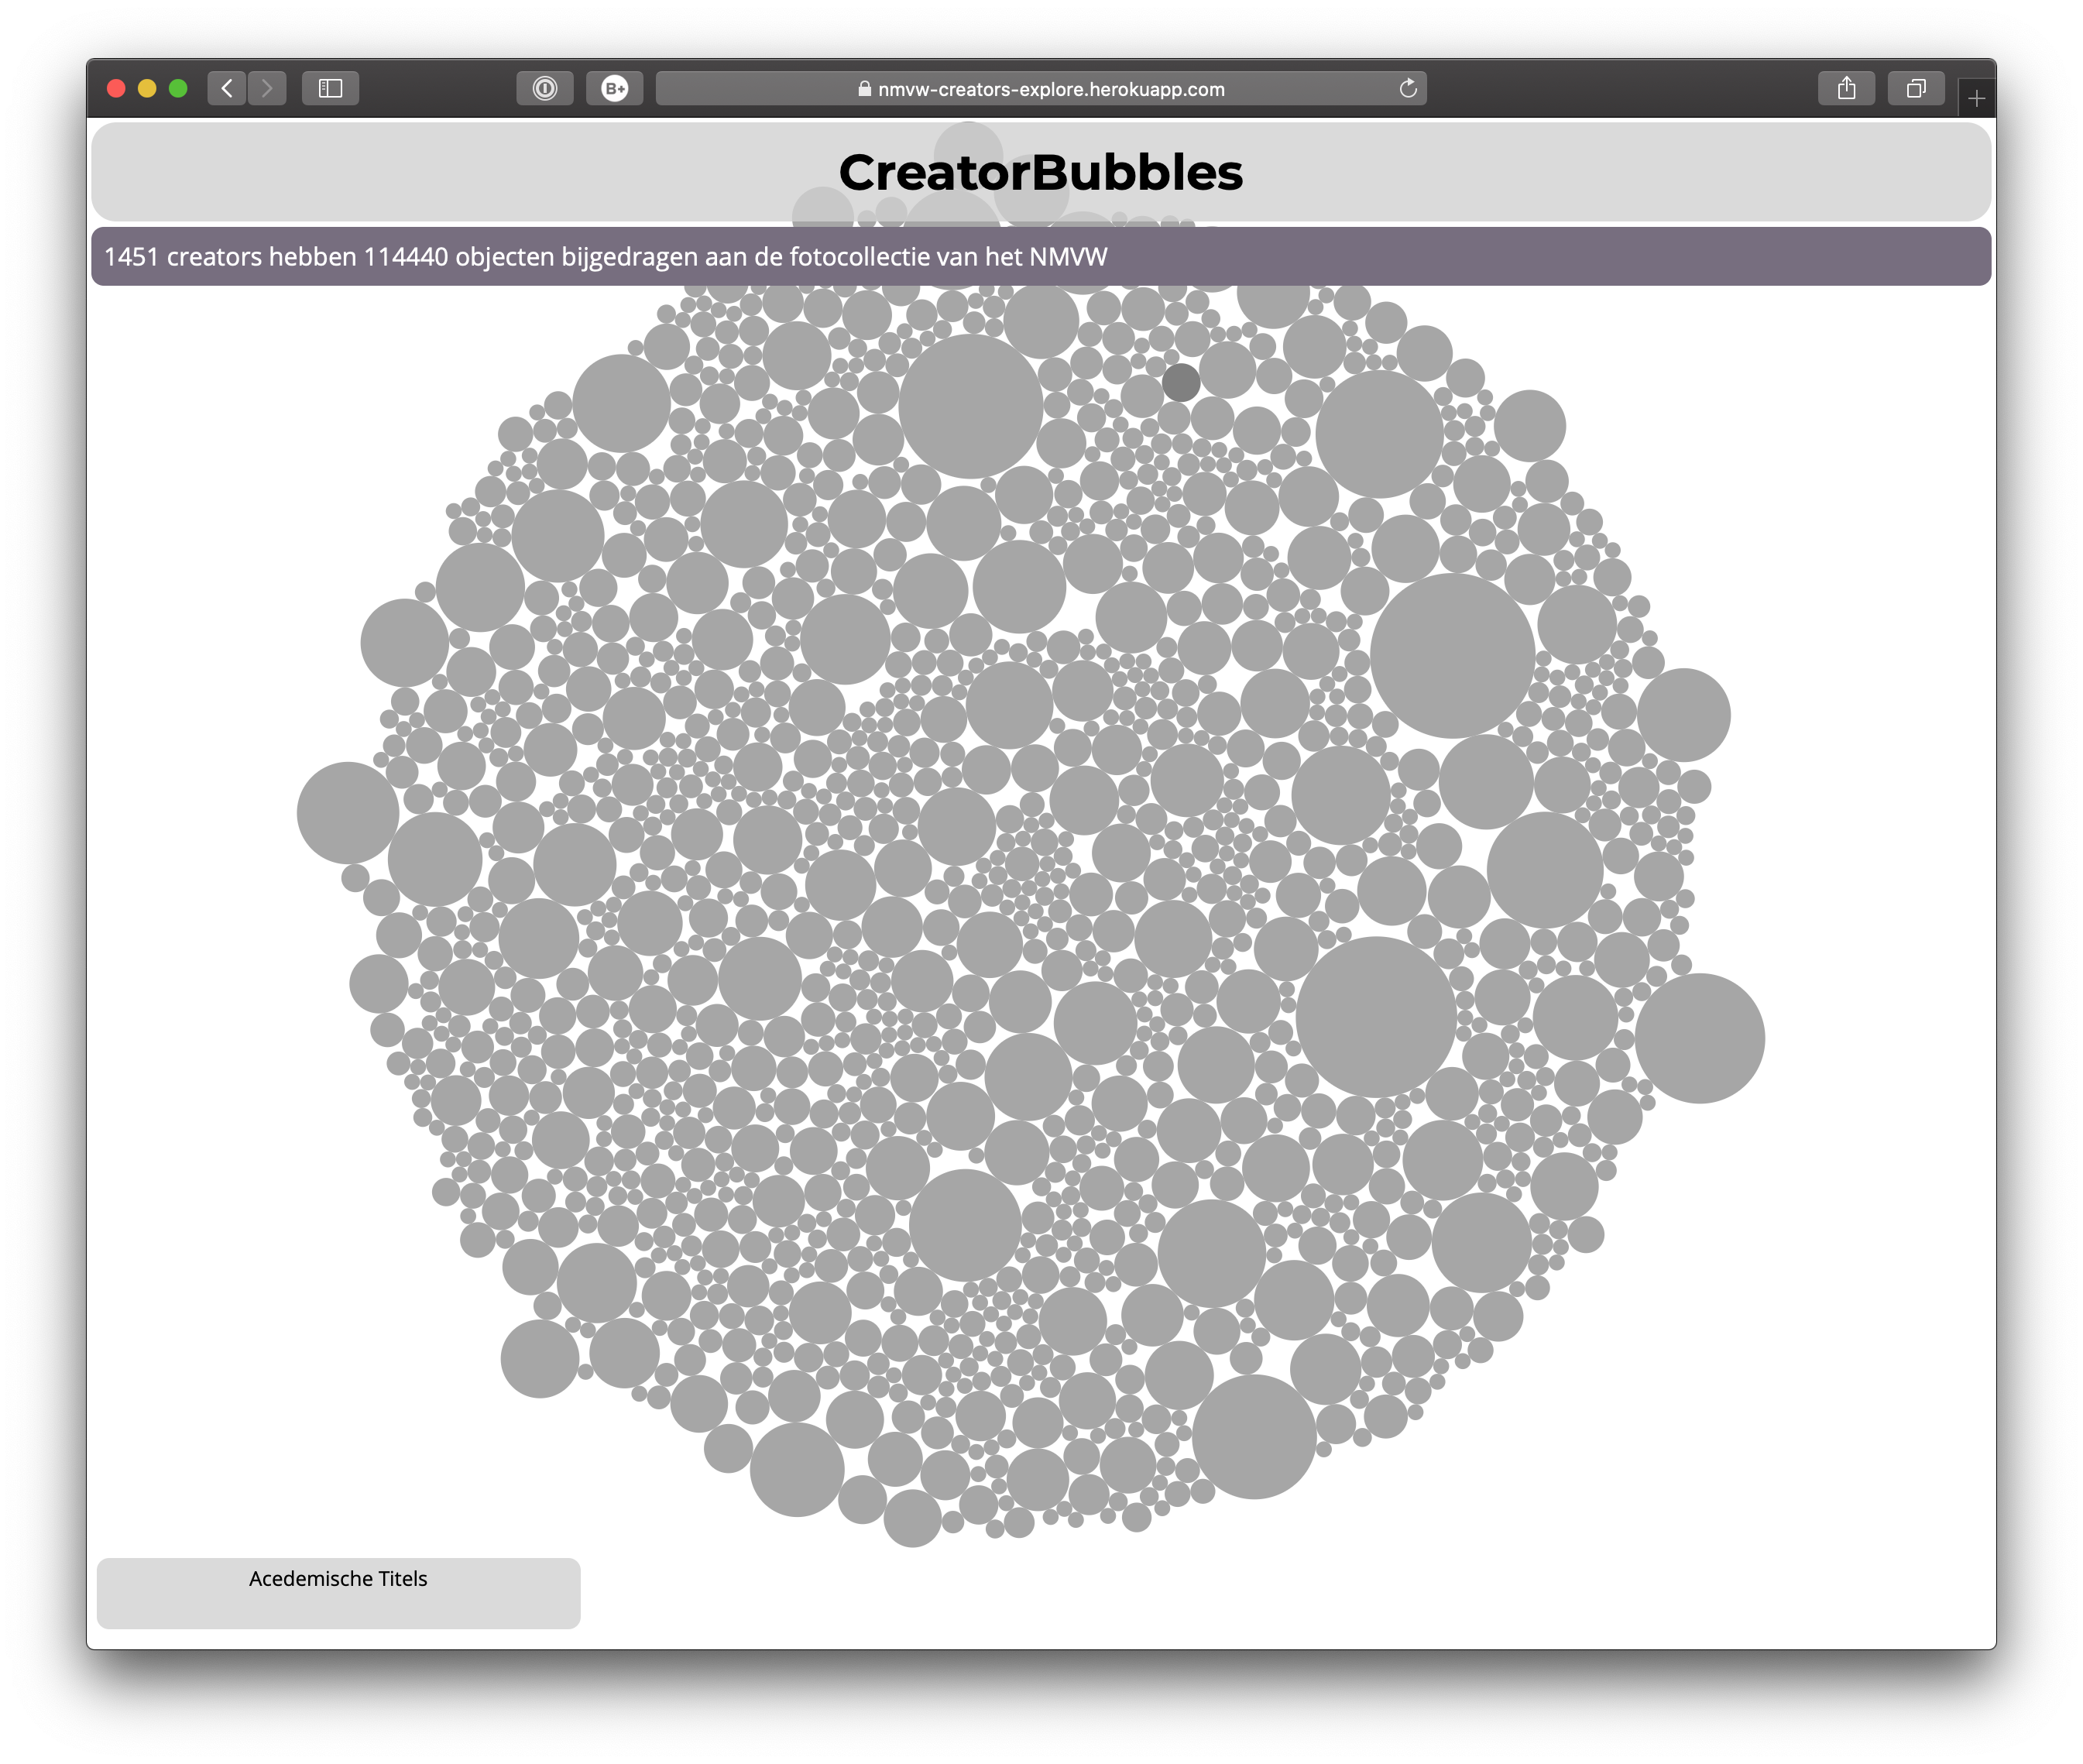
This visualization is about exploring the photographic collection from the NVMW split out on the person who made the photo. The lager the bubble, the more items in the collection are from that creator and made interactive by clicking on the bubble to get more info on that creator. The overlay can also be changed depending on the layer selected (acedemic title, male/female etc.) It is live at https://nmvw-creators-explore.herokuapp.com
This concept is a continuation of the concept from the previous subject Functional Programming
This repo is for the subject frontend-data from the Tech Track
This concept is a continuation of the previous subject Functional Programming
The goal for the subject is to create an interactive visualization of data for the National Museum of World Cultures.
Create a data visualisation (using the d3 library) based on given data where data can be explored through interaction using enter, update, and exit. - Tech Track CMDA: Assignment
The process, iteration and choices I made during this project are documented on the Wiki.
To get a chronological view, start by reading the journal. The journal contains a small day to day summary of my work and a link to the relevant page with detailed information.
Follow these instructions to use the app:
- Clone the repository to you machine
git clone https://github.com/iSirThijs/functional-programming.git- Install dependencies
npm install
- Start the server
npm run dev
or with nodemon
npm run dev-nodemon
During grading this assignment, the one thing missing was the documentation. This should have been on the wiki but due to poor timemanagement and constrains I wasn't able to fix it. The only thing necessary for this assignment is the updated documentation on the wiki.
