-
Notifications
You must be signed in to change notification settings - Fork 516
Profiling App Launch
This document will explain how to profile the startup of the .NET Podcasts app on an iOS device. It assumes you already have .NET and the mobile workloads installed.
See Profiling for information about how to profile the app using .NET's profiler.
-
Clone the dotnet-podcasts repository:
$ git clone https://github.com/microsoft/dotnet-podcasts
-
Build the project for Release:
$ cd dotnet-podcasts/src/Mobile $ dotnet build /bl /p:Configuration=Release /p:NoSymbolStrip=true Microsoft.NetConf2021.Maui.csprojWe build for Release to make sure we're not wasting time profiling debug code.
We also add
NoSymbolStrip=trueto the build, which will make sure we don't strip away native symbols from the executable. This way stack traces in Instruments will be much more helpful. -
Run the project to install the app on your device
$ dotnet build /bl /p:Configuration=Release /p:NoSymbolStrip=true Microsoft.NetConf2021.Maui.csproj /t:Run
This will install the app on your device so that Instruments will find it.
-
Profiling the app
-
Launch Instruments.
-
Select your device at the top.
-
Select the
.NET Podsapp in the list of installed apps. -
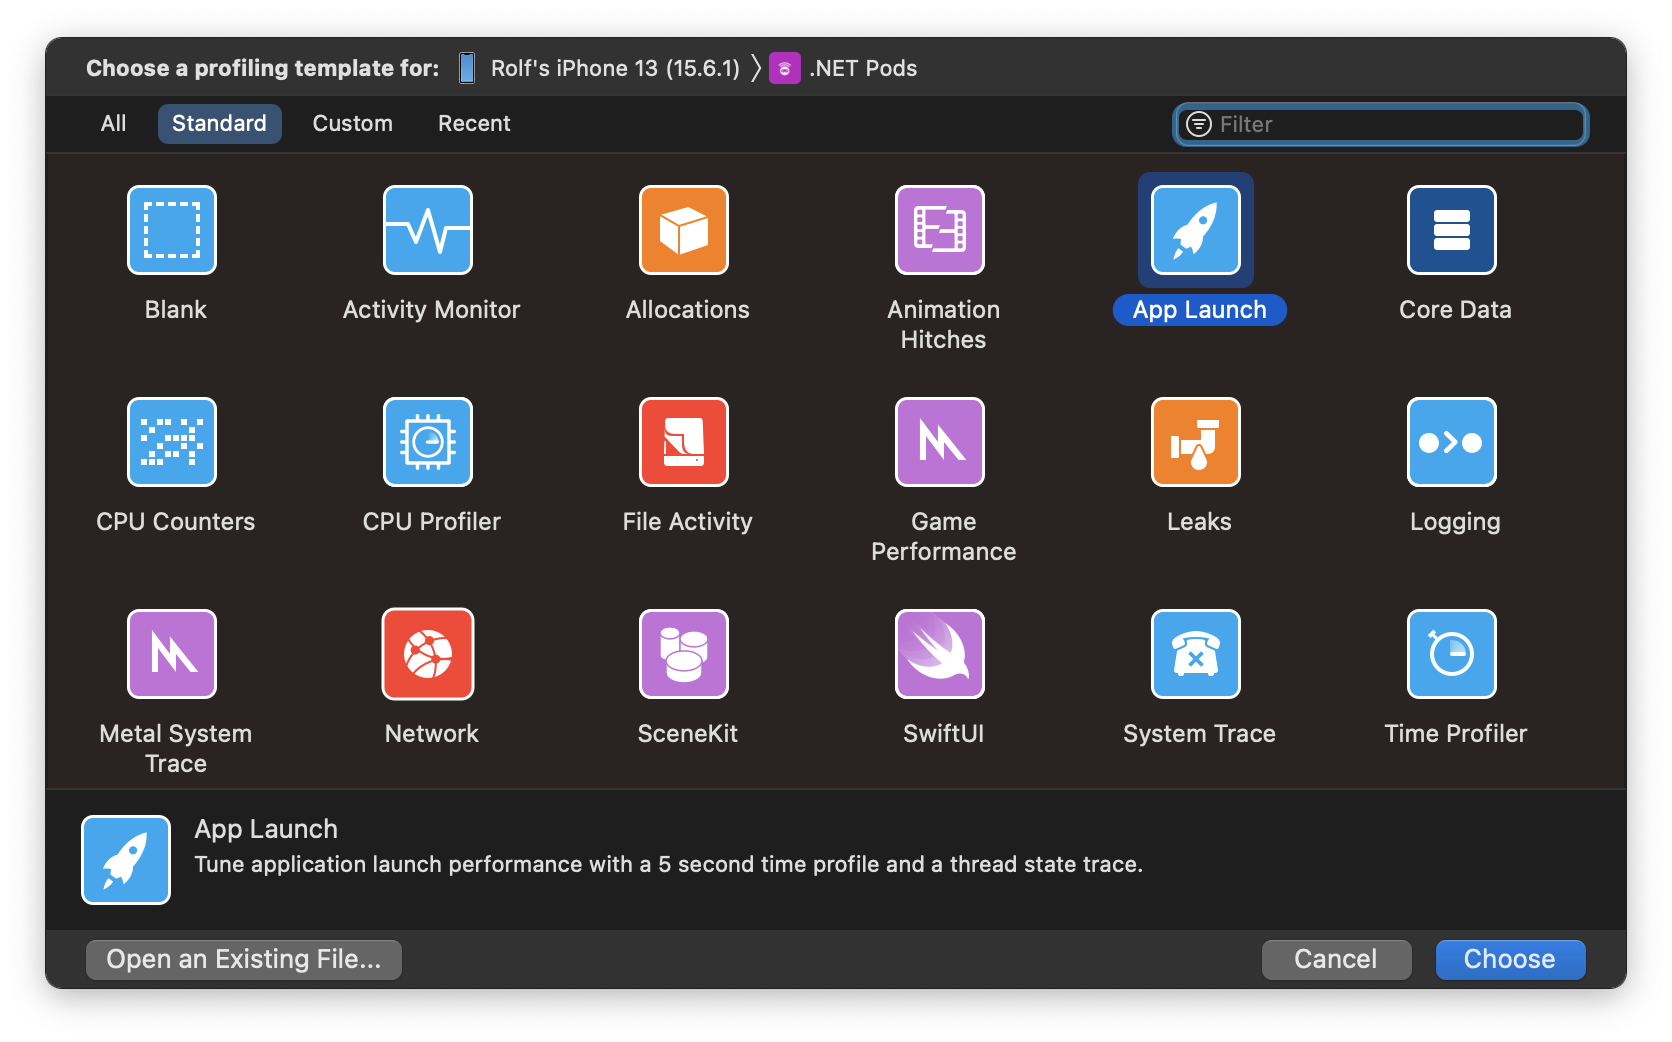
Select the
App Launchinstrument.
-
Click Choose

-
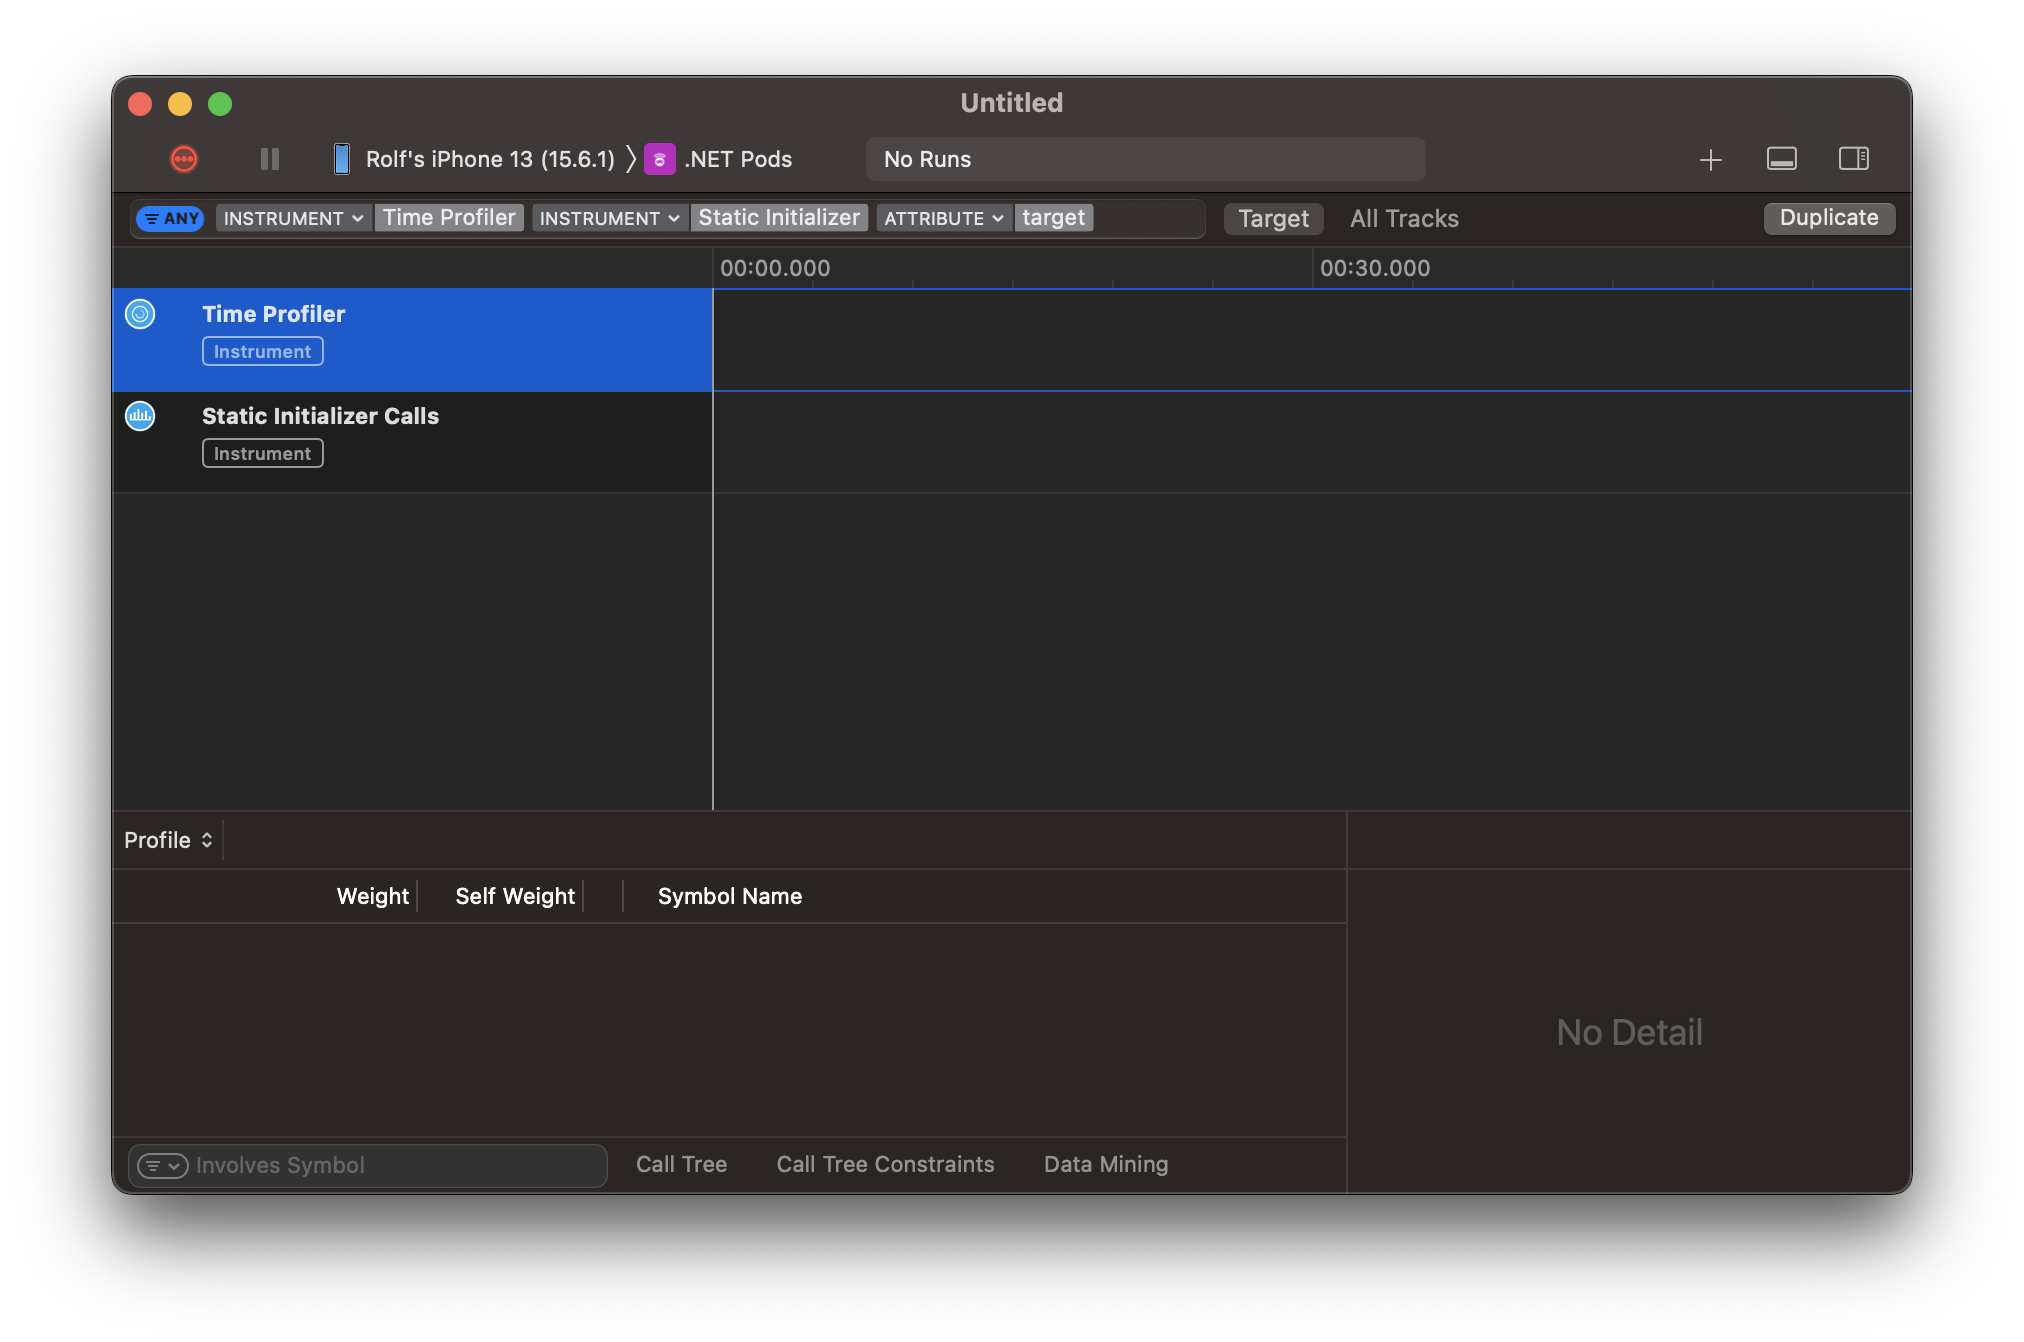
Hit the Record button in the top-left corner.
-
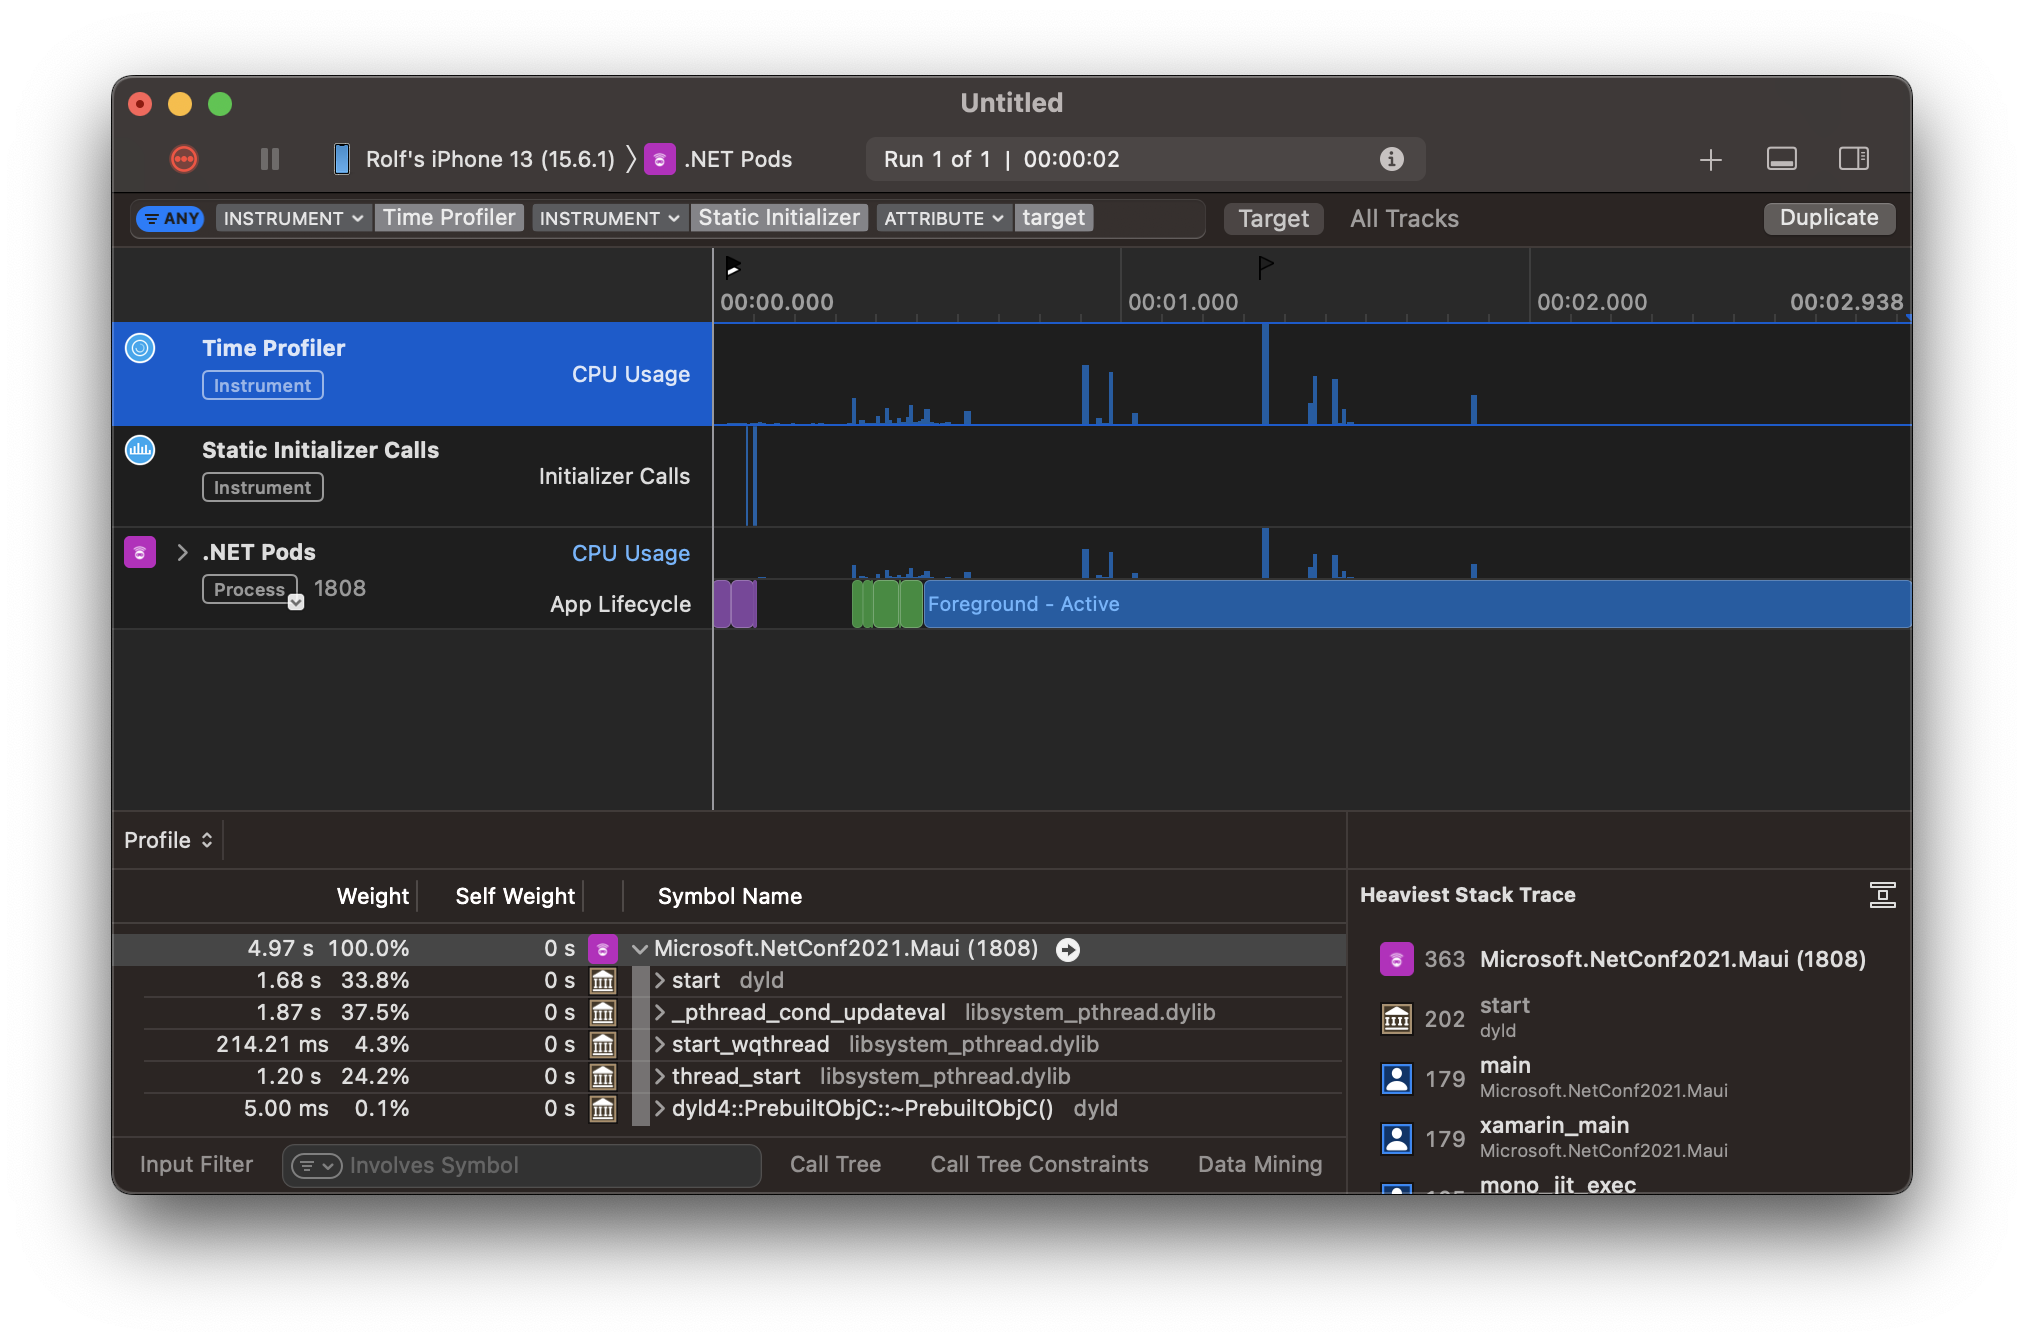
The app will now launch. Since we're only interested in the startup sequence, we can stop profiling (by hitting the stop button) once the app has launched.

-
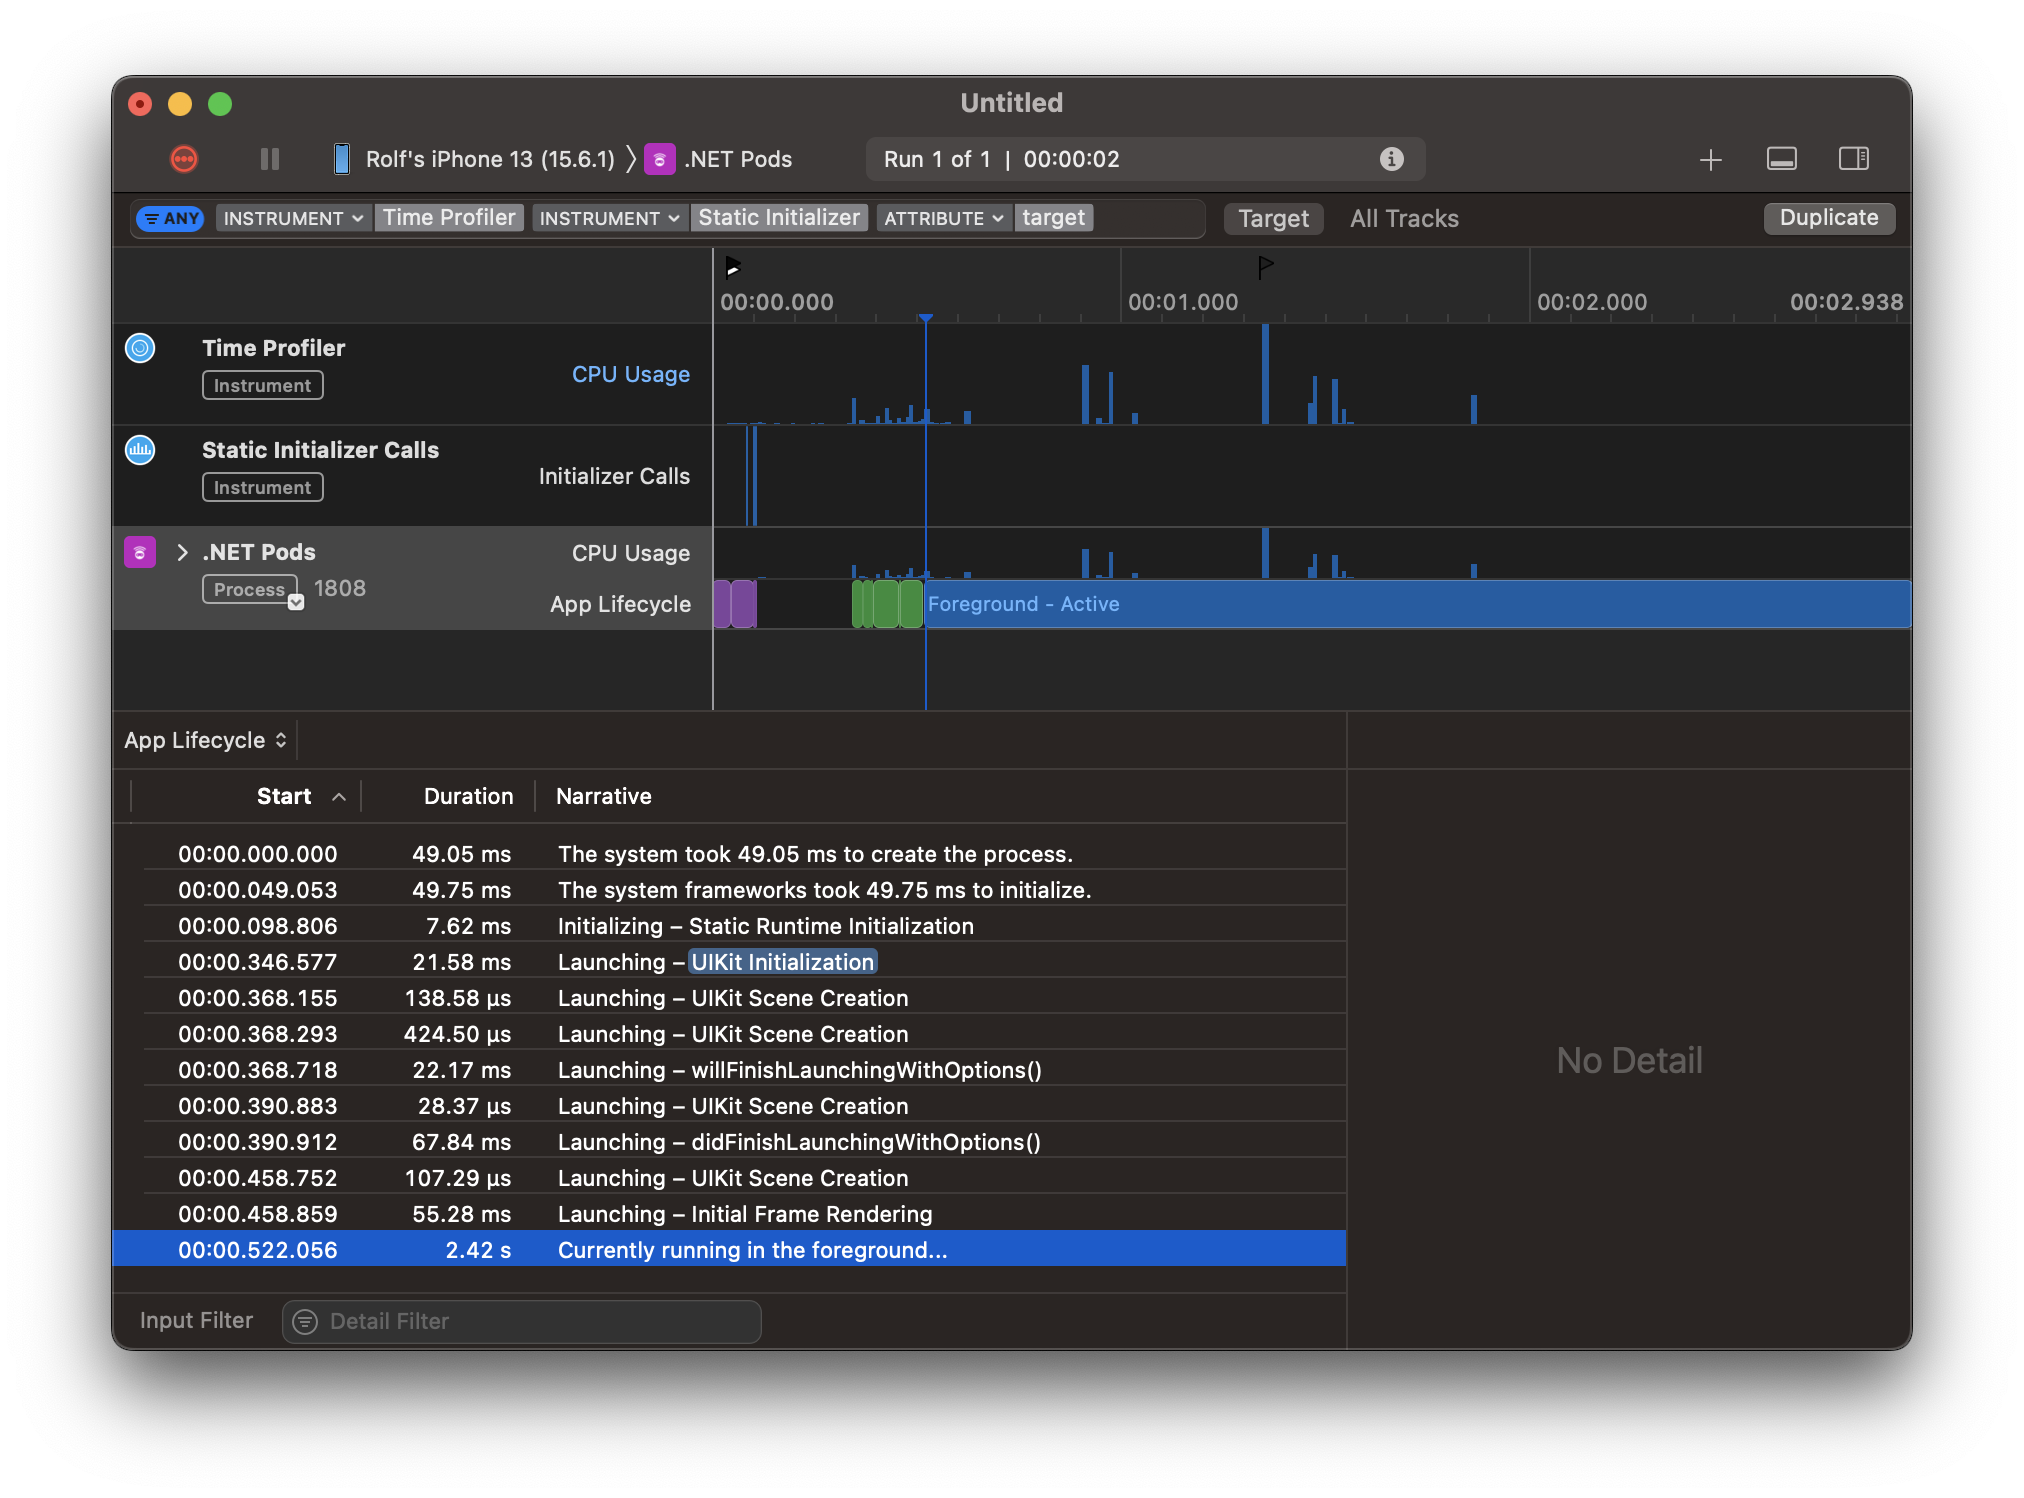
Selecting the third row (App Lifecycle) will show the lifecycle of the app. Usually the most interesting data point is when the app has completed launching, this is the last row in the table at the bottom ("Currently running in the foreground..."). For this particular launch it took the app 0.522s to complete launching.

-
-
Further reading
Instruments is an extremely powerful profiling tool, and there are a wealth of options and ways to dig into the profiling data. More information about Instruments can be found online - this page about Reducing App Launch Time could be a good start.
- README
- xcode13.0 Binding Status
- xcode13.1 Binding Status
- xcode13.2 Binding Status
- xcode13.3 Binding Status
- xcode13.4 Binding Status
- xcode14.0 Binding Status
- xcode14.1 Binding Status
- xcode14.2 Binding Status
- xcode14.3 Binding Status
- xcode15.0 Binding Status
- xcode15.1 Binding Status
- xcode15.3 Binding Status
- xcode15.4 Binding Status
- xcode16.0 Binding Status
- xcode16.1 Binding Status
- xcode16.2 Binding Status